Has the Universal DH Made MLB Offense More Effective?
Impact of the Universal DH
In 2022, MLB implemented Rule 5.11, the universal designated hitter (DH), an at the time controversial rule change for fans of the National League (NL). For American League (AL) fans, this rule meant very little, as the DH had already been adopted by the AL in 1973. It was believed that this rule change was made as a way to increase offense in a league already seeing slumping offensive numbers. The idea was simple: replacing a pitcher (who hit just .114 from 2015 to 2021) with a non-pitcher (who hit .255 league-wide) would raise offensive output.
While the universal DH is still quite new, we now have 3 full years of data to see if the leagues saw any increase in offense during this time. There are some caveats to talk about first that have greatly affected many aspects of the game. In 2023, the pitch clock and the shift ban were major changes that have had an effect on the game. The pitch clock has changed the way pitchers attack hitters as well as the mind games that could be played during at-bats. The extent of this impact is definitely worthwhile as a breakdown in the future. Banning of the shift, unfortunately, might overlap with some of the data in this analysis, as this rule was also implemented as a way to increase offense in the game. The conclusions may reframe our question from looking at just the universal DH to looking at the overall recent rule changes intended to increase offense, but starting the argument centered around the DH brings more eyes.
Overview of Potential Indicators and Data Sources
What are some offensive telltales that we can look at to see any change in offense of the past few years?
- Batting Average (AVG): I think this is the most straightforward, as we can see if more at bats are resulting in hits or not.
- Home Runs (HR): One of the three true outcomes of baseball. While I do not think this is the greatest stat to look at, it is a familiar stat to those unfamiliar with baseball.
- Slugging Percentage (SLG): This stat gives insight into power hitting. It will allow us to see not just are players getting hits, are they getting extra-base hits that are more likely to contribute to runs scored.
- On-Base Percentage (OBP): While walks may not be seen as impactful, they still involve one of the three true outcomes and help to provide more runs should someone get an extra-base hit.
- On-base Plus Slugging (OPS): This captures the combinating of OBP and SLG and helps show how productive hitters are being.
- Runs (R): Runs, especially Runs/game, can show you how explosive the offense has been over the year.
- Exit Velocity (EV): Exit velocity gives insight into how hard of contact players are making with the ball. While not necessarily a positive result, it does give opposing players less time to make a play.
- Launch Angle (LA): Launch angles correspond to how the ball was hit. Certain launch angles will result in certain outcomes and may give us insight into how batters are approaching the ball. Higher average launch angles could indicate more home runs being hit.
- Barrel Rate (%): Barrel rate takes into account exit velocity and launch angle giving us an idea of quality contact. A higher barrel rate may indicate that the player makes consistent, solid contact versus getting a lucky swing.
For reference: The three true outcomes refer to home runs, walks, and strikeouts. They are outcomes that do not involve defensive play beyond the pitcher and/or catcher.
We will be getting our data from Baseball Savant. I highly recommend checking the site out if you are a fan of baseball and stats. The statcast era of baseball has been a treat for us, and Baseball Savant provides a ton of data and visuals that make baseball more enjoyable. That being said, because we are using Baseball Savant, we are limited to the statcast era, which is from 2015-Present.
Before we get started, we do have to make a couple of changes to how we are interpreting the data. Normally, you would want to look at players who met the minimum plate appearance qualifiers, which for batting would be 3.1 plate appearances per game. The qualified plate appearance threshold is usually used when looking at statistics due to the larger sample size of at-bats, meaning that league or team averages do not get skewed because a player with a few at-bats inflates or deflates the average. It ensures you are only looking at the players who shaped the league and not a few one-offs from players brought up and sent down to the minors.
The elephant in the room, the 2020 COVID season. During my analysis, I will talk about stats without the COVID season. When going through the data, I realized that there were multiple anomalies compared to any of the other seasons within this range. This is likely due to the shortened season (60 games vs 162 games), certain players opting out of play, and certain players getting sick during the season. I encourage you to look at this season in detail on your own, but for now, I will be looking at the full 162 game seasons as the basis for my conclusions.
Getting into the Numbers
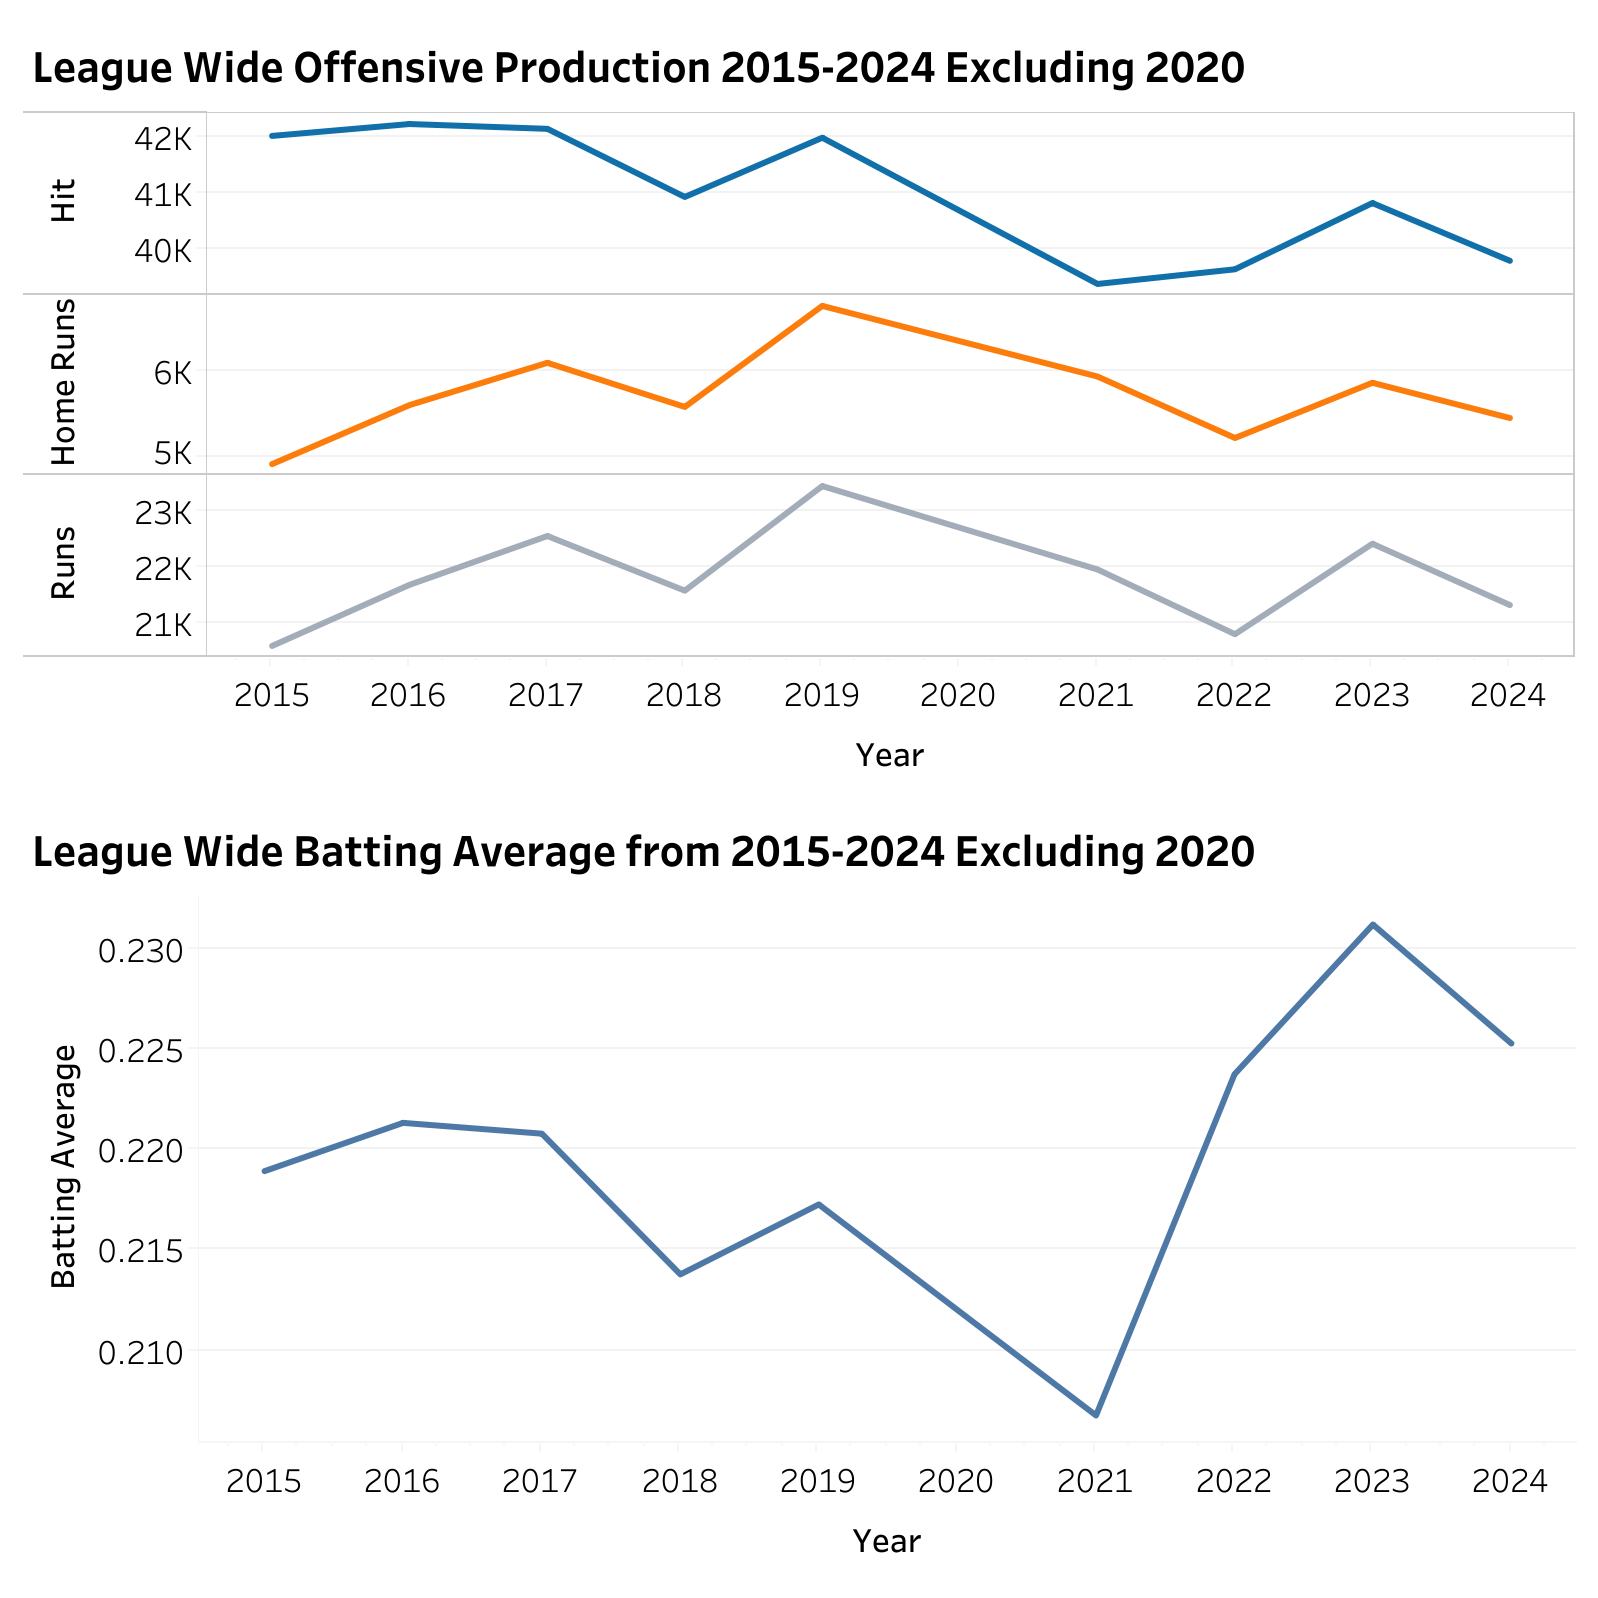
If you grew up collecting baseball cards before the Statcast era, some of the first statistics you think of are hits, home runs, RBIs, and batting average, and while I think the significance of these stats has been eclipsed by some more advanced metrics, it is a great place to start. When looking at these stats (we will use runs instead of RBI as we are looking for league performance over individual), we see that hits overall have been on the decline since 2017. For home runs and runs, there are some ups and downs year over year, with 2019, the season of the “juiced ball”, being the peak. Taking out the 2019 season, there is less than a 1% difference in runs scored per season in the last three years compared to the 2015-2021 seasons before the universal DH, showing that there has not been an increase or decrease in these stats since the rule was implemented.
With these initial stats in mind, you may be saying:
“Well, isn’t an increase in production the reason why the universal DH was implemented? Hits have continued downward in the 2022 season and are still low in the 2024 season. The rule change has not increased the number of runs being scored. Does this mean the universal DH was a failure?”
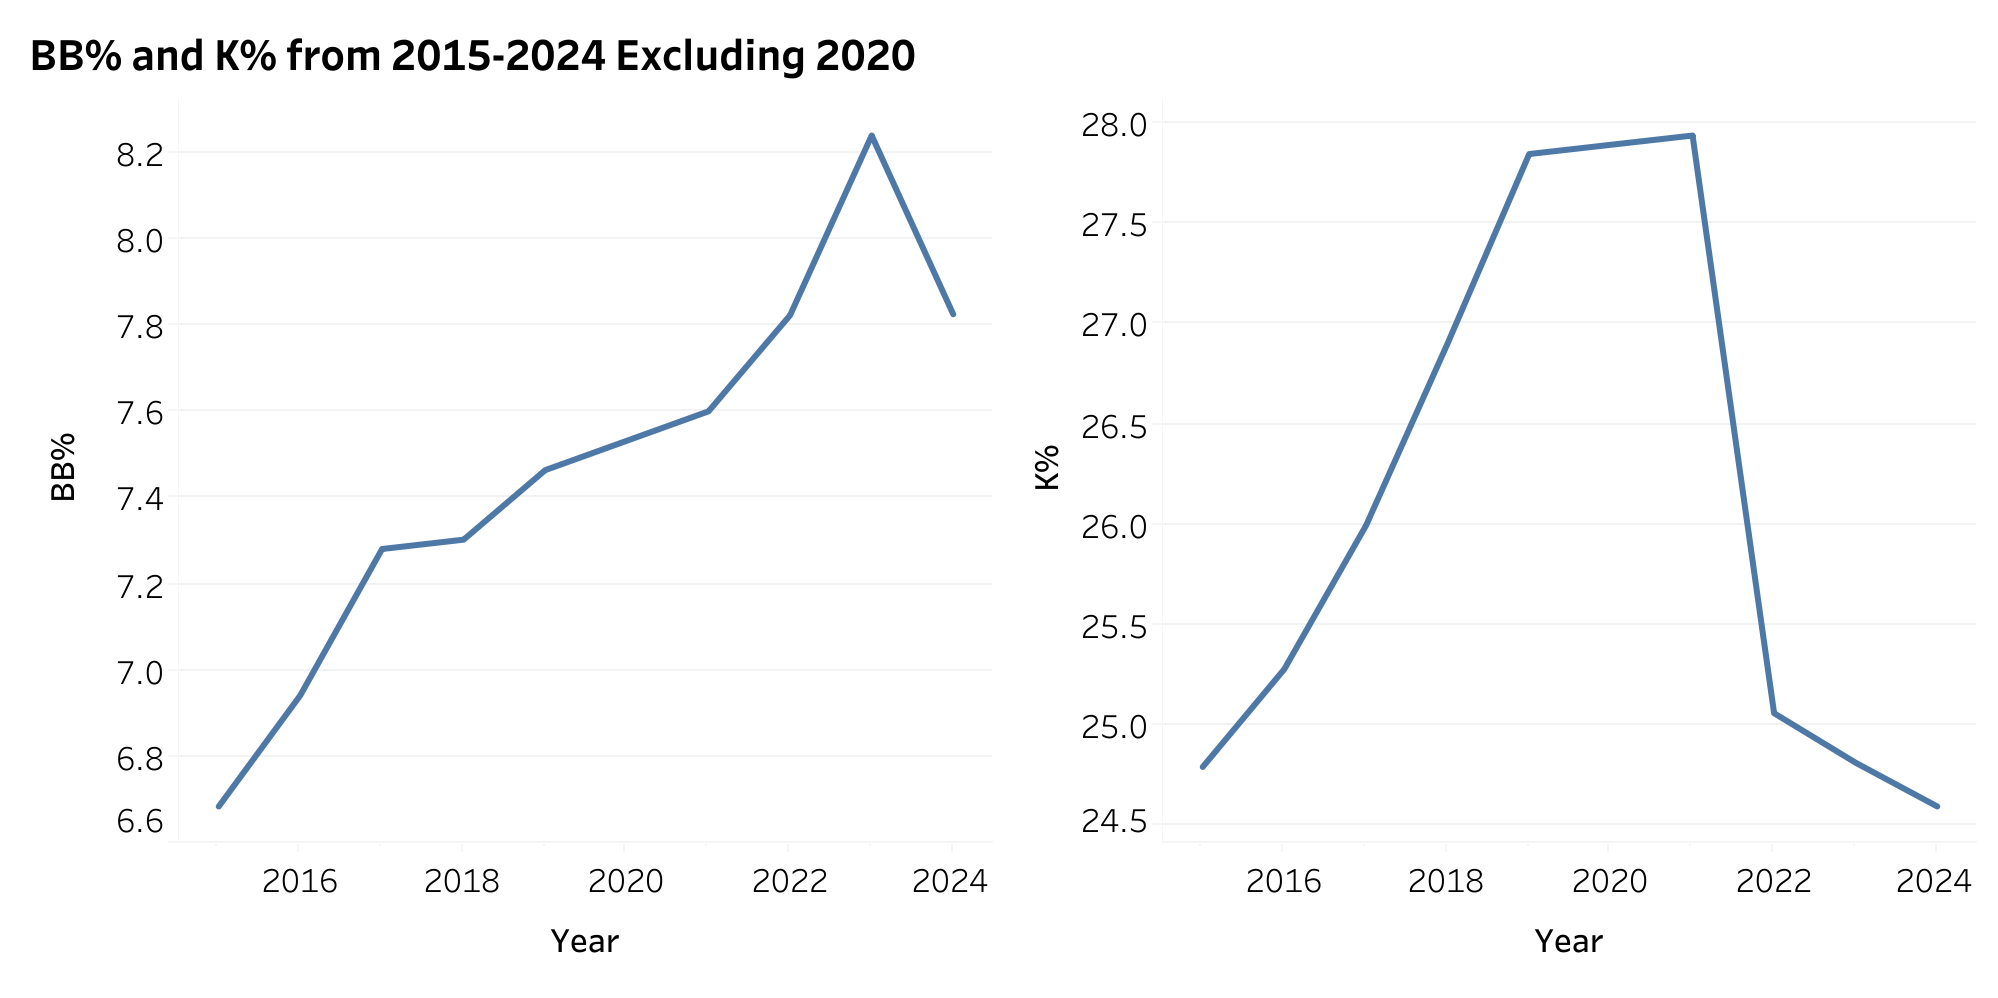
The short answer, no. This is where the power of rate-based stats helps show the whole picture over aggregated stats. We can start by taking a look at one of the standard rate-based stats in baseball, batting average. This paints a different picture. While batting averages were slumping from 2017 onward, with a low in 2021, the season of the universal DH implementation saw an 8% increase in batting average. If the number of hits has decreased, why has there been an uptick in average? Looking at the 2021 and 2022 seasons more closely, we see a 0.5% increase in plate appearances, a 0.7% increase in hits, but a 3% increase in walks (BB) and a 10% decrease in strikeouts (K). This indicates that players are likely more efficient and effective at the plate, getting more hits and walks while striking out less. This quality at the plate provides more opportunities for offensive production, even if hits and plate appearances are relatively flat.
The increase in quality at the plate can additionally be seen in contact metrics like exit velocity, launch angle, and barrel rate. There has been a general trend upwards over the past 9 years. Launch angles have increased 45% since 2015, with a rise to 12.8 degrees in 2024. To put it in perspective, ground balls are under 10 degrees, line drives are in the 10-25 degree range, and fly balls are 25-50 degrees. Since the implementation of the universal DH, we see that the league-wide average launch angle has comfortably moved into the line drive range, meaning groundouts are less likely and increasing the chance for a ball to make it past the infield and get the batter on base, increasing the chance of scoring with the next play.
The barrel rate gives us even more insight into the increase in quality at-bats. Since 2015, the league-wide rate has jumped 71% with even a 20% increase over the 2019 season. This indicates that hitters are not just swinging harder. They are making consistently better contact, which is increasing the opportunities for more potent offenses. Now equating this solely to the universal DH misrepresents the current environment we see in baseball training. While the DH means that there is no longer the “easy out” in the lineup, as every hitter can pose a threat, there has been a shift in attitude towards a data-driven focus in baseball. A lot of hitters and coaches are emphasizing swing mechanics to specifically improve exit velocity and launch angle so that their barrel rates are higher. This sustained rise is seen where 2023 and 2024 increase over 2022 for these metrics, whereas if the initial increase was solely on the DH rule change, we would see a leveling out after implementation.
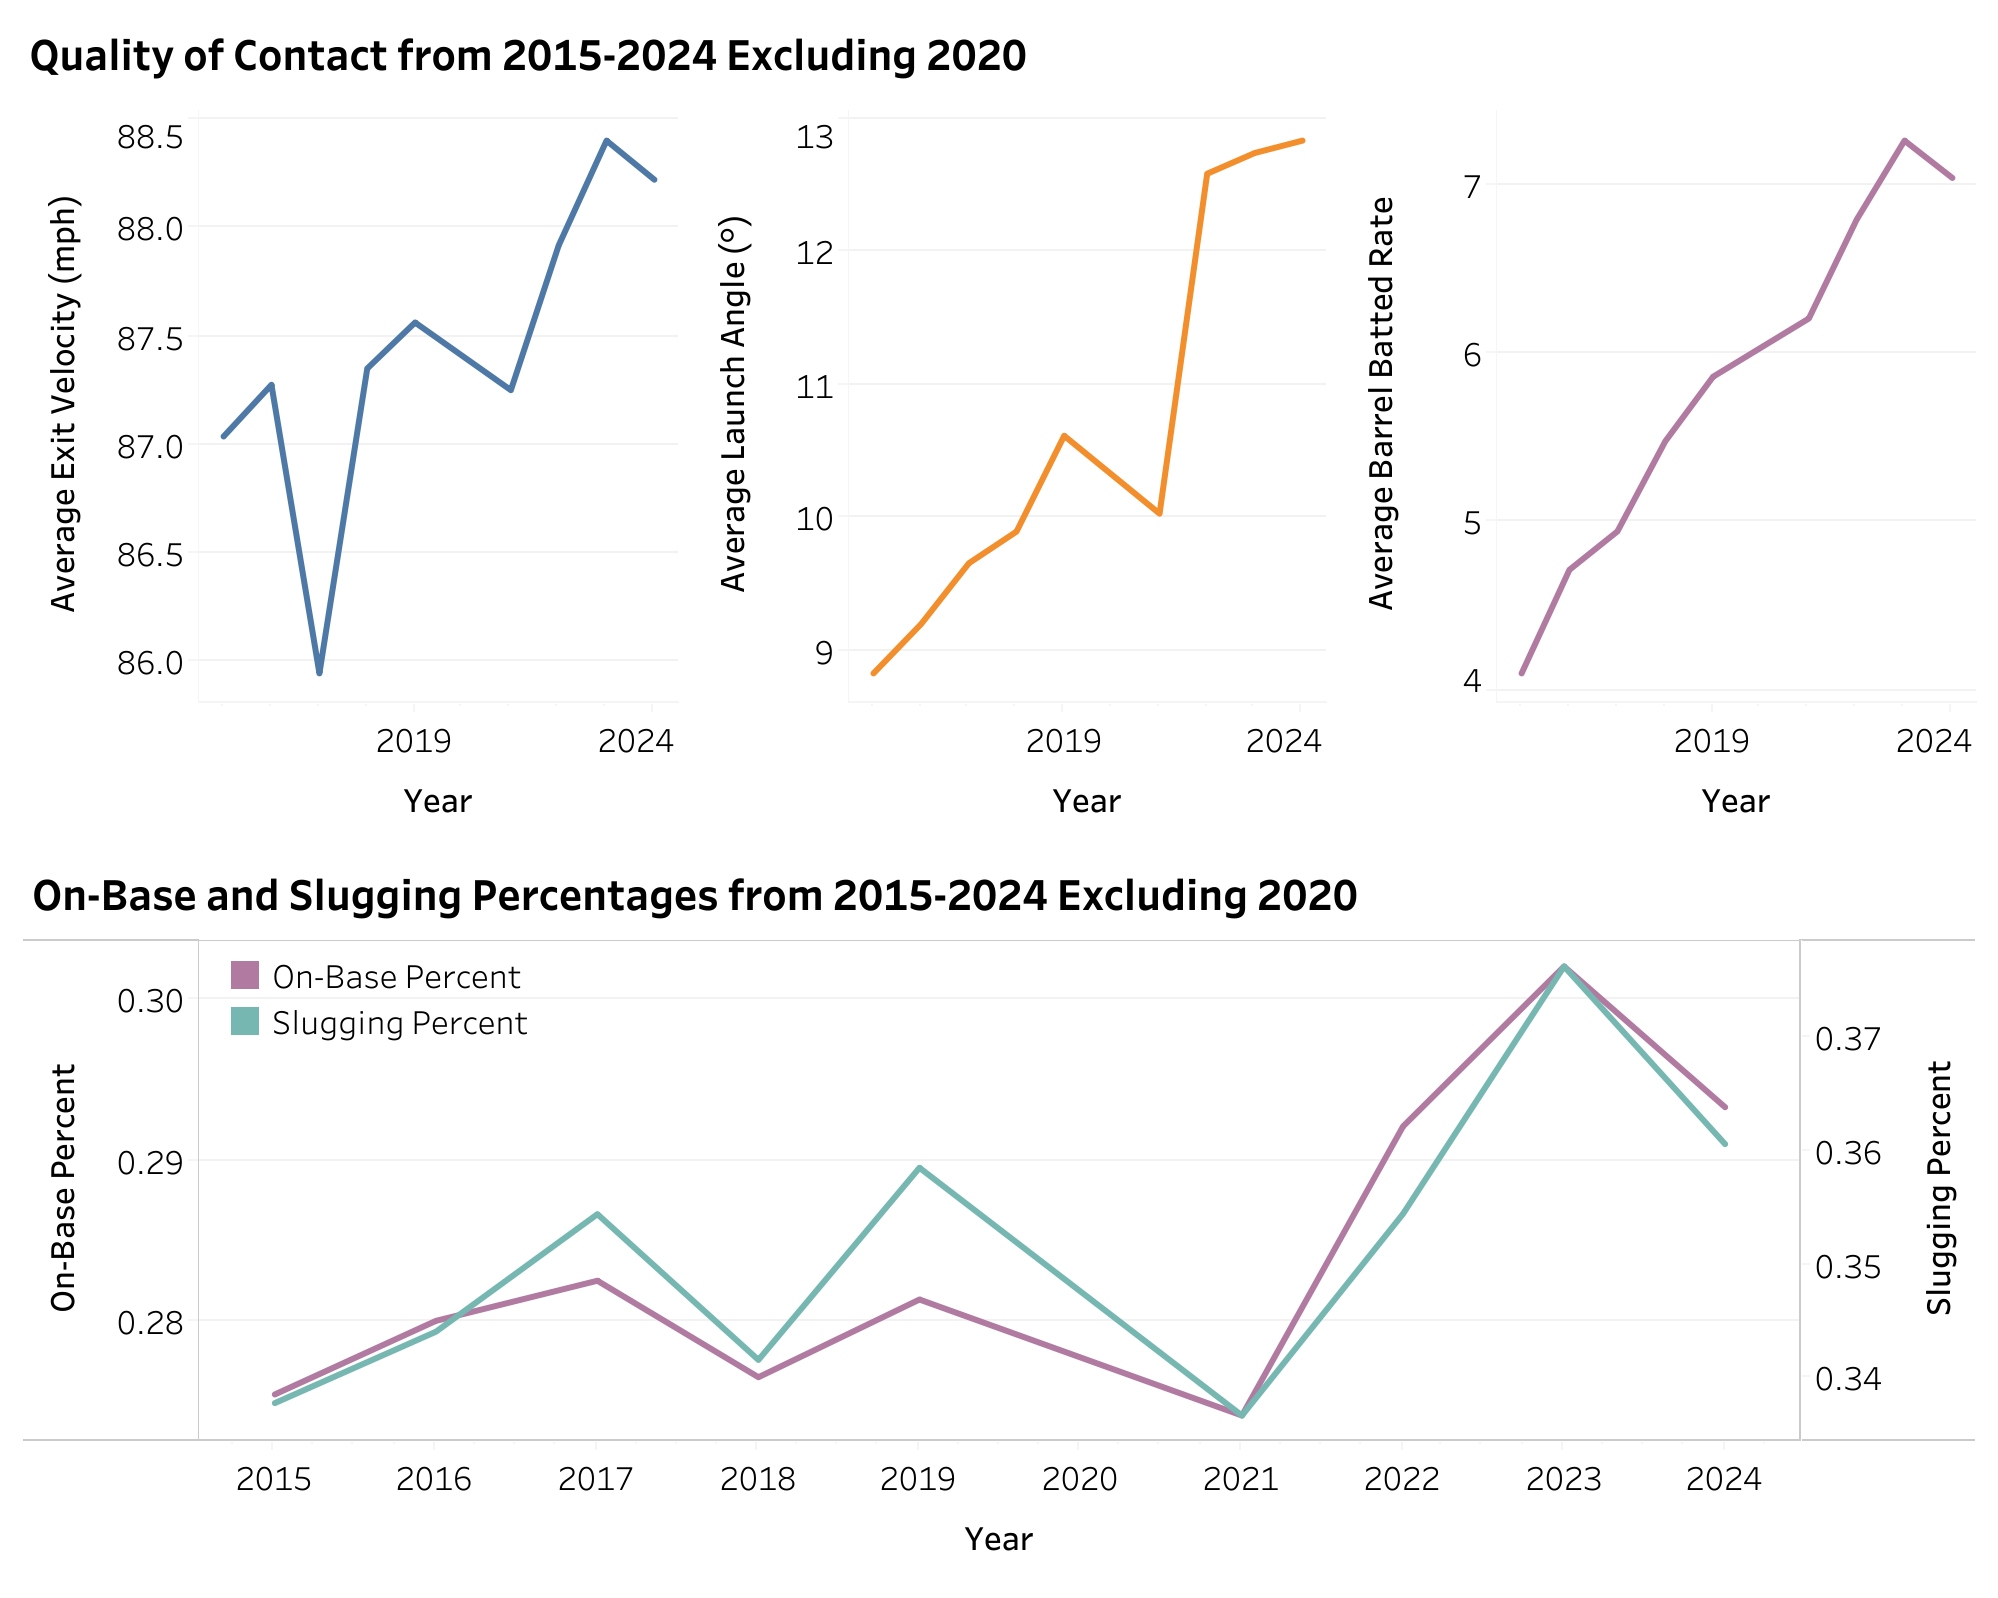
Plate approach is additionally visible in OBP and SLG trends. Both OBP and SLG have seen a rise since the bottom 2021 season are even higher than other peaks in the 2015-2021 range. OBP helps reflect the improved plate discipline with players having a greater ability to reach base through both hits and walks. At the same time, slugging has risen significantly from the pre-universal DH era, meaning that hitters are making better, more impactful contact. Together, these gains drive up OPS, highlighting a shift toward more efficient, high-leverage offense. Hitters today are not just swinging harder; they are swinging smarter and punishing pitchers more effectively than ever before.
Did the Universal DH Improve Offense?
While aggregate metrics might show no improvement, rate-based metrics show that at least a combination of rule changes, like universal DH, banning of the shift, and pitch clock, have positively affected the offense of the game. The DH change itself looks to have increased offense when comparing the 2022 season to prior seasons, like the slumping 2021 season, but also the “juiced ball” 2019 season. That being said, during this time, players and trainers have become more analytics-focused focused which is likely why we are still seeing a rise in some of these metrics. Replacing the “easy out” pitcher batting with a productive hitter, while not the easiest to measure to what extent, has had a positive impact on the increase in offense these past 3 years.
If you are curious and want to play around with the data yourself, I highly recommend grabbing the Tableau Viz! Hopefully, soon I will have an analysis on how recent rule changes like 3 batter minimum and pitch clock have affected pitching statistics!
Interactive Tableau Dashboard